Nickel has been on quite a roller coaster ride recently. The price of the metal plummeted in 2020 during the pandemic and then rose steadily through 2021 to reach a seven-year high. The market became especially jittery in February 2022 when fears arose over a potential supply shortage resulting from sanctions on Russia, the third-largest nickel producer, following its invasion of Ukraine.
Over the period, China-based Tsingshan Holding Group, the largest nickel and stainless-steel producer in the world, had built up a significant short position as a hedge. Speculators were aware of Tsingshan’s position, and they took on large, long positions culminating in a short squeeze in March 2022.
On March 7, the three-month spot price on the London Metal Exchange (LME) closed at $48,078 per metric ton. The following day, the price soared to $101,365 per metric ton in early trading, and then dropped back to $80,000 per metric ton. The LME suspended trading, and all trades after 0000 GMT were cancelled.
So what happened?
“As nickel prices skyrocketed, market participants got margin calls and ultimately ran out of cash to post as collateral at the clearing house, causing a liquidity crisis,” says Benjamin Evans, Lead Data Scientist at Nasdaq. “Trading resumed on March 16, but nickel was only allowed to trade within certain limits until March 22.”
Marex Spectron data, which is available on Nasdaq Data Link, provides insight into the recent dynamics in the nickel market. As background, it is important to understand the perspective of the three types of players. Producers are naturally long physical nickel, so they sell futures or forward contracts to hedge the risk that the price is going to fall. Consumers – including companies that make batteries for electric vehicles – buy futures or forward contracts to hedge the risk of a price rise and lock in their costs. Both participant types transfer their risk to speculators, who seek to profit from price movements up or down, depending on their view of the market.
Marex Daily Speculative Positioning measures how speculators are positioned on the LME and Shanghai Futures Exchange (SHFE). The chart below shows the percentage of open interest that is speculative on both exchanges since the beginning of December 2021. Essentially, at the same time producers were building short positions, speculators were building extremely large, long positions.

Generally, between 0% and 20% of the open interest is speculative trading. However, by the beginning of March 2022, about 60% of the open interest on the LME and about half of the open interest on the SHFE was speculative trading. Notice that the percentage of speculative positions has declined from the peak in early March.
“Excessive volatility has drained liquidity,” says Evans. “Market participants have been exiting their open positions and not initiating new ones because they are concerned that they may not be able to close them later. As such, producers and consumers now represent a greater percentage of open interest.”
What was the reaction?
Marex Media Intensity monitors data feeds, news and social media channels to understand what commodity and macro topics people are talking about, and within those topics, what aspects or factors they are talking about. Specifically, it monitors whether people are discussing factors relating to supply, demand or speculation.
The chart below shows that at the beginning of March, people were most often talking about speculation in the market given the remarkable ramp up in the price of nickel. Conversations about the supply side also increased given the Russian invasion of Ukraine. While there was some discussion about the demand for nickel, the change was not as significant. That said, another short squeeze and further prices rises could negatively affect demand, especially in the stainless-steel sector, at which time we might expect to see a change in the level of conversation about demand.

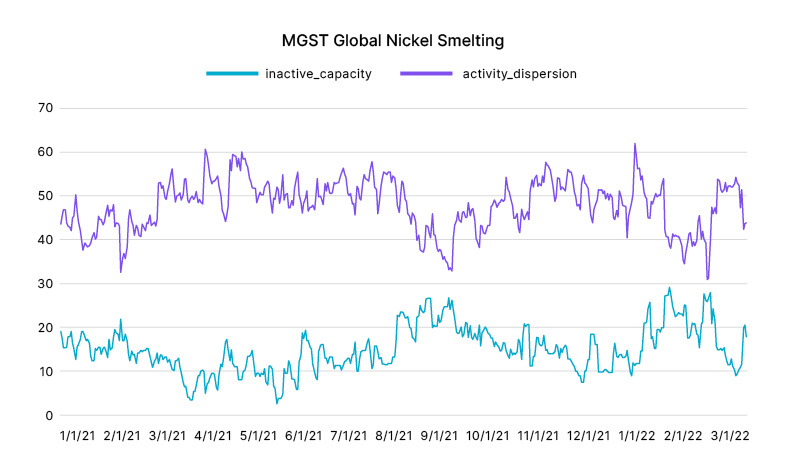
Finally, Marex Global Smelter Tracker monitors real-time activity in copper and nickel smelters through satellite images developed in partnership with geospatial intelligence company Earth-i. The activity is tracked in two ways. Activity dispersion measures how active the smelters are in production. Inactive capacity is the percentage of nickel smelters that are offline. These two measures are negatively correlated, and they range from 0 to 100.
The chart below indicates that since Russia invaded Ukraine, activity dispersion has increased and inactive capacity has decreased, but the change is relatively small, and they are not at record levels. Keep in mind, inactive capacity can only go to 0, indicating that all nickel smelters are smelting, so the measure is constrained. The data also indicates that producers realize that the recent price spike reflects financial market activity and does not reflect fundamentals and the fair value of nickel.

“This analysis is a great demonstration of the intricacies of the metal markets, and how Marex data can shine a light on its inner workings. We’re excited to continue our partnership with Nasdaq Data Link, and offer more transparency into the commodities markets through these volatile times.”
Guy Wolf, Global Head of Market Analytics, Marex
Nasdaq® is a registered trademark of Nasdaq, Inc. The information contained above is provided for informational and educational purposes only, and nothing contained herein should be construed as investment advice, either on behalf of a particular security or an overall investment strategy. Neither Nasdaq, Inc. nor any of its affiliates makes any recommendation to buy or sell any security or any representation about the financial condition of any company. Statements regarding Nasdaq-listed companies or Nasdaq proprietary indexes are not guarantees of future performance. Actual results may differ materially from those expressed or implied. Past performance is not indicative of future results. Investors should undertake their own due diligence and carefully evaluate companies before investing. ADVICE FROM A SECURITIES PROFESSIONAL IS STRONGLY ADVISED. © 2022. Nasdaq, Inc. All Rights Reserved.
